Split-Apply-Combine Pattern in Data Modeling
Split-Apply-Combine
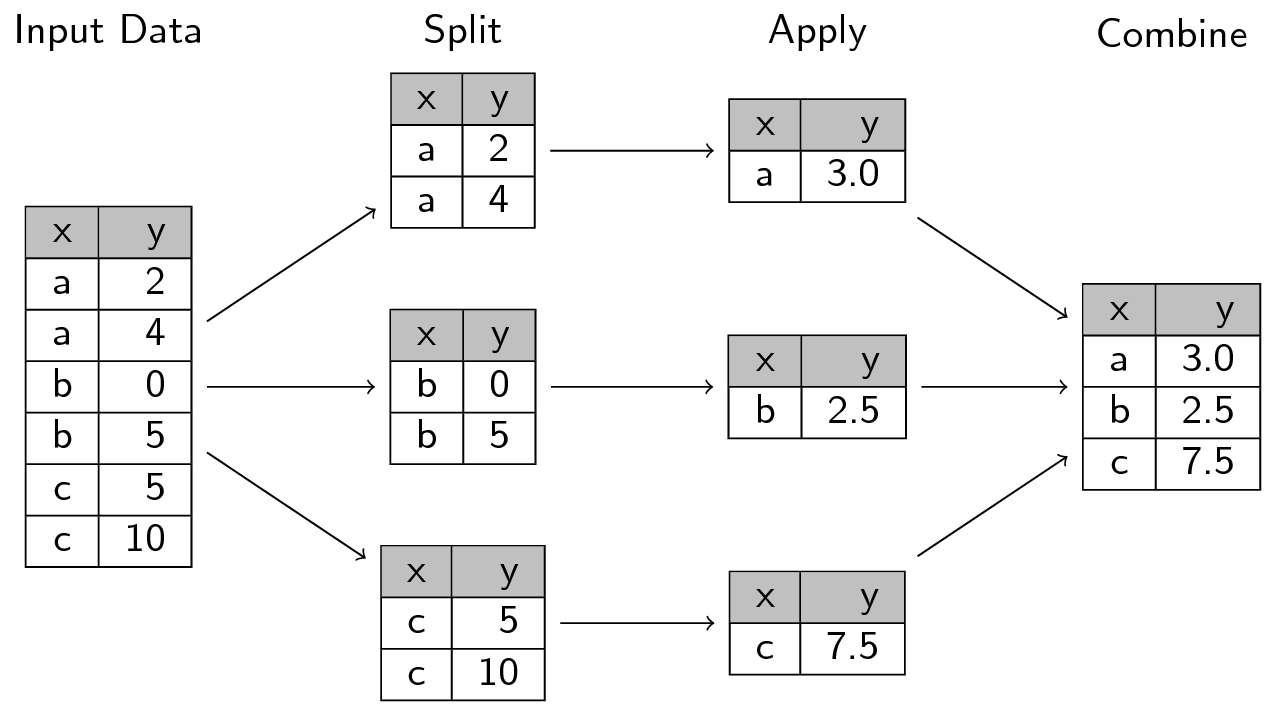
A common analytical pattern is to:
- split data into pieces,
- apply some function to each piece,
- combine the results back together again.
Generally avoid using loops when you need to do Split-Apply-Combine, consider these alternatives instead:
- Entry level:
dplyr::group_by() - General approach: nesting
*apllyfunctions andplyrpackage (non-tidyverse solution)
Exercise
- Fit linear regression models of the daily bike counts on percipitation, min and max temperature, first for all bridges together and then for each bridge separately using the split-apply-combine pattern;
- Extract the results from models in the above step:
- Compare the R-squares of the bridge-specific model. The bike traffic of which bridge has the highest correlation with percipitation, min and max temperature?
- Which model has the largest percipitation coefficient? Temperature coefficient?