Overview and Introduction
Set up your computer
Installation
- Download and install R 3.5.1 from https://ftp.osuosl.org/pub/cran/ . (Requires administrator/root privellege)
- Install the latest RStudio Desktop free version from https://www.rstudio.com/products/rstudio/download/
- Follow these steps to install Git. (Requires administrator/root privellege)
If you already have R and RStudio installed on your laptop, it’d be a good idea to check their version and upgrade them to the latest (if they are not).
Installation Verification
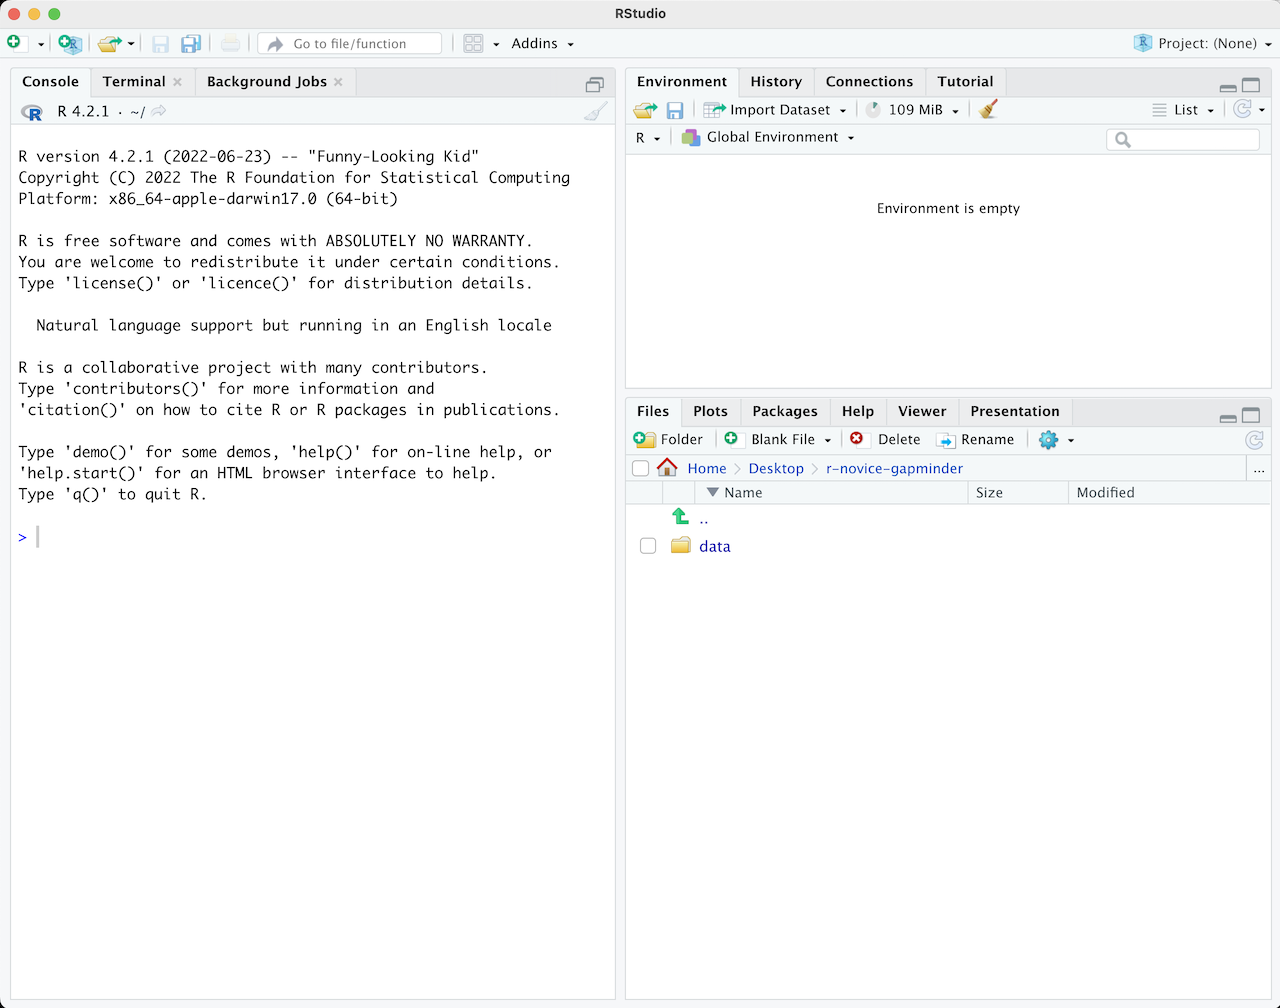
- Launch RStudio and you should see a program window like this:
- Click the File menu, select New Project…, then Version Control and Git;
- Copy & paste this URL: https://github.com/cities/datascience2018.git into the the Repository URL textbox;
- Click Create Project.
If you see a popup box that says “Clone Repsitory” with a progress bar and then RStudio refreshes, then your installation is working.
What is Data Science?
According to Wikipedia:
Data science is an interdisciplinary field that uses scientific methods, processes, algorithms and systems to extract knowledge and insights from data in various forms, both structured and unstructured, similar to data mining.
Data science is a “concept to unify statistics, data analysis, machine learning and their related methods” in order to “understand and analyze actual phenomena” with data. It employs techniques and theories drawn from many fields within the context of mathematics, statistics, information science, and computer science.
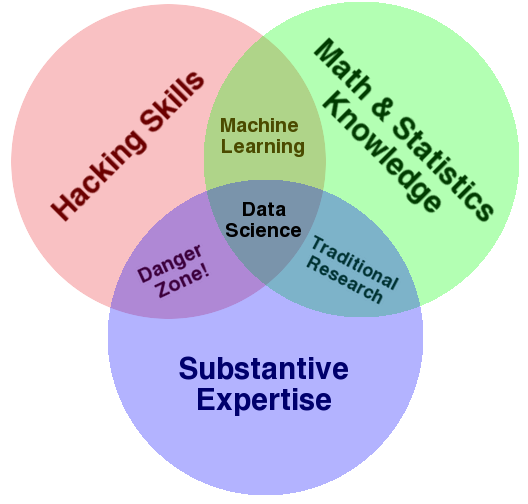
Data Science Venn Diagram by Drew Conway
Resources
- What is Data Science? by datascience@Berkeley
- A Taxonomy of Data Science by Hilary Mason and Chris Wiggins
- “You can’t do data science in a GUI” by Hadley Wickham
- Why Do We Need Data Science When We’ve Had Statistics for Centuries? by Irving Wladawsky-Berger
Why R
- Free, as in beer & speech
- Large and growing community, with More than 15,000 packages and counting
- Powerful and flexible
- Graphics Gallery
- Interactive Web Apps: Interactive Plots, Dashboard, Widget …
- Packages for doing statistics & machine learning, creating documents, grabbing/processing data …
Class project
For the class project, you are expected to create a re-usable R script with the following requirements and commit it to GitHub:
Part I
- Contains at least one self-contained function;
- Follows a consistent style guide;
- Completed with necessary documentation;
- Has at least one test that passes;
- [Advanced] Organizes the function(s) into a package that passes the checks
- Part II
- Utilzes tidyverse functions as much as possible
- [Advanced] Includes a vignette that demonstrates the usage of the package
You can take and/or re-organize code from your current work or start from scratch. Take the feasibility of completing in a week into consideration when selecting project ideas.
If you don’t have a feasible project idea at the moment, consider writing a R package that reads and visualizes the bike counts on Steel Bridge, Hawthorne Bridge, and Tilikum Crossing. Daily traffic counts data for these bridges can be found here. At the minimum, your package should be able to:
- Read the data in the excel file;
- Process (tidy) the data as necessary;
- Visualize bike counts crossing a bridge based on a data frame passed in;
- Plot daily bike counts for any specified period;
- [Advanced] Plot daily, weekly, or monthly bike counts based on a frequency argument;
- [Advanced] Overlay weather data for Portland and study (visualize and/or model) the effect of weather on bike traffic;
- [Advanced] Study (visualize and/or model) the effect of Tilikum Crossing (opened in September 2015) on bike counts crossing other bridges.