Part II: Overview and Introduction
Overview
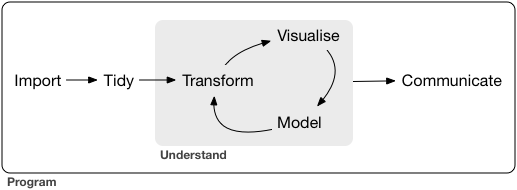
Data Science is a discipline that combines computing with statistics. A data analysis problem is solved in a series of data-centric steps: data acquisition and representation (Import), data cleaning (Tidy), and an iterative sequence of data transformation (Transform), data modelling (Model) and data visualization (Visualize). The end result of the process is to communicate insights obtained from the data (Communicate). This class will take you through all the steps in the process and will teach you how to approach such problems in a systematic manner. You will learn how to design data analysis pipelines as well as how to implement data analysis pipelines in R. The class will also emphasize how elegant code leads to reproducible science.
The tidyverse workflow
The tidyverse packages
- Website: http://www.tidyverse.org/packages/
- Install with
install.packages("tidyverse")
Pipe operator
%>% pipes an object forward into a function or call expression
- Basic piping
- x %>% f is equivalent to f(x)
- x %>% f(y) is equivalent to f(x, y)
- x %>% f %>% g %>% h is equivalent to h(g(f(x)))
- Using
%>%with unary function calls
require(tidyverse)## Loading required package: tidyverse## Loading tidyverse: ggplot2
## Loading tidyverse: tibble
## Loading tidyverse: tidyr
## Loading tidyverse: readr
## Loading tidyverse: purrr
## Loading tidyverse: dplyr## Conflicts with tidy packages ----------------------------------------------## filter(): dplyr, stats
## lag(): dplyr, statsiris %>% head## Sepal.Length Sepal.Width Petal.Length Petal.Width Species
## 1 5.1 3.5 1.4 0.2 setosa
## 2 4.9 3.0 1.4 0.2 setosa
## 3 4.7 3.2 1.3 0.2 setosa
## 4 4.6 3.1 1.5 0.2 setosa
## 5 5.0 3.6 1.4 0.2 setosa
## 6 5.4 3.9 1.7 0.4 setosairis %>% tail## Sepal.Length Sepal.Width Petal.Length Petal.Width Species
## 145 6.7 3.3 5.7 2.5 virginica
## 146 6.7 3.0 5.2 2.3 virginica
## 147 6.3 2.5 5.0 1.9 virginica
## 148 6.5 3.0 5.2 2.0 virginica
## 149 6.2 3.4 5.4 2.3 virginica
## 150 5.9 3.0 5.1 1.8 virginica- Placing lhs as the first argument in rhs call
## What are the outputs for these two lines?
3 %>% `-`(4)
iris %>% head(5)
iris %>% tail(5)- Placing lhs elsewhere in rhs call
## What are the outputs for these
3 %>% `-`(4, .)
4 %>% c("A", "B", "C", "D", "E")[.]
More information available at: http://magrittr.tidyverse.org/
RStudio keyboard shortcut for %>%:
- ctrl-Shift-M (Windows)
- Command-Shift-M (Mac)
Class project
For the class project for Part II, you are expected to follow the tidyverse work flow and use the tidyverse suite of packages to conduct an analytic project using data of your choice. Your project should involve these steps:
- Data importing and tidying;
- Data transformation;
- Data Visualization;
- [Optional] Data modeling;
- [Optional] Reproducible reporting.
You can use data from your current work or continue a project you have been working on. Take the feasibility of completing in a week into consideration when selecting project ideas.
If you don’t have a feasible project idea at the moment, consider continuing to analyze the bike counts data on Hawthorne Bridge and Tilikum Crossing from Part I. Daily traffic counts data for these two bridges can be found here.
Sample analytic questions are:
- After accounting for seasonal variation, is there a trend in bike traffic across these two bridges?
- How was the bike traffic affected by weather (temperature, precipitation, etc)?
- Was the bike traffic on the Hawthorne Bridge affected by the opening of Tilikum Crossing?
You can work on any one or all of these questions with visualization and/or modeling after you import, tidy and transform the data when necessary.